Mortality: Pensioner mortality variation
Modelling the mortality of DB pensioners is, in many ways, about as easy as mortality modelling gets – experience data is typically very high quality and often strongly credible, anti-selection is not usually a big deal and the available rating factors are limited (which constrains model complexity).
I suggest that it’s even simpler in that, for most pension plan mortality modelling, it is sufficient to assume that pensioner mortality varies monotonically in one-dimension along a low-high mortality axis.
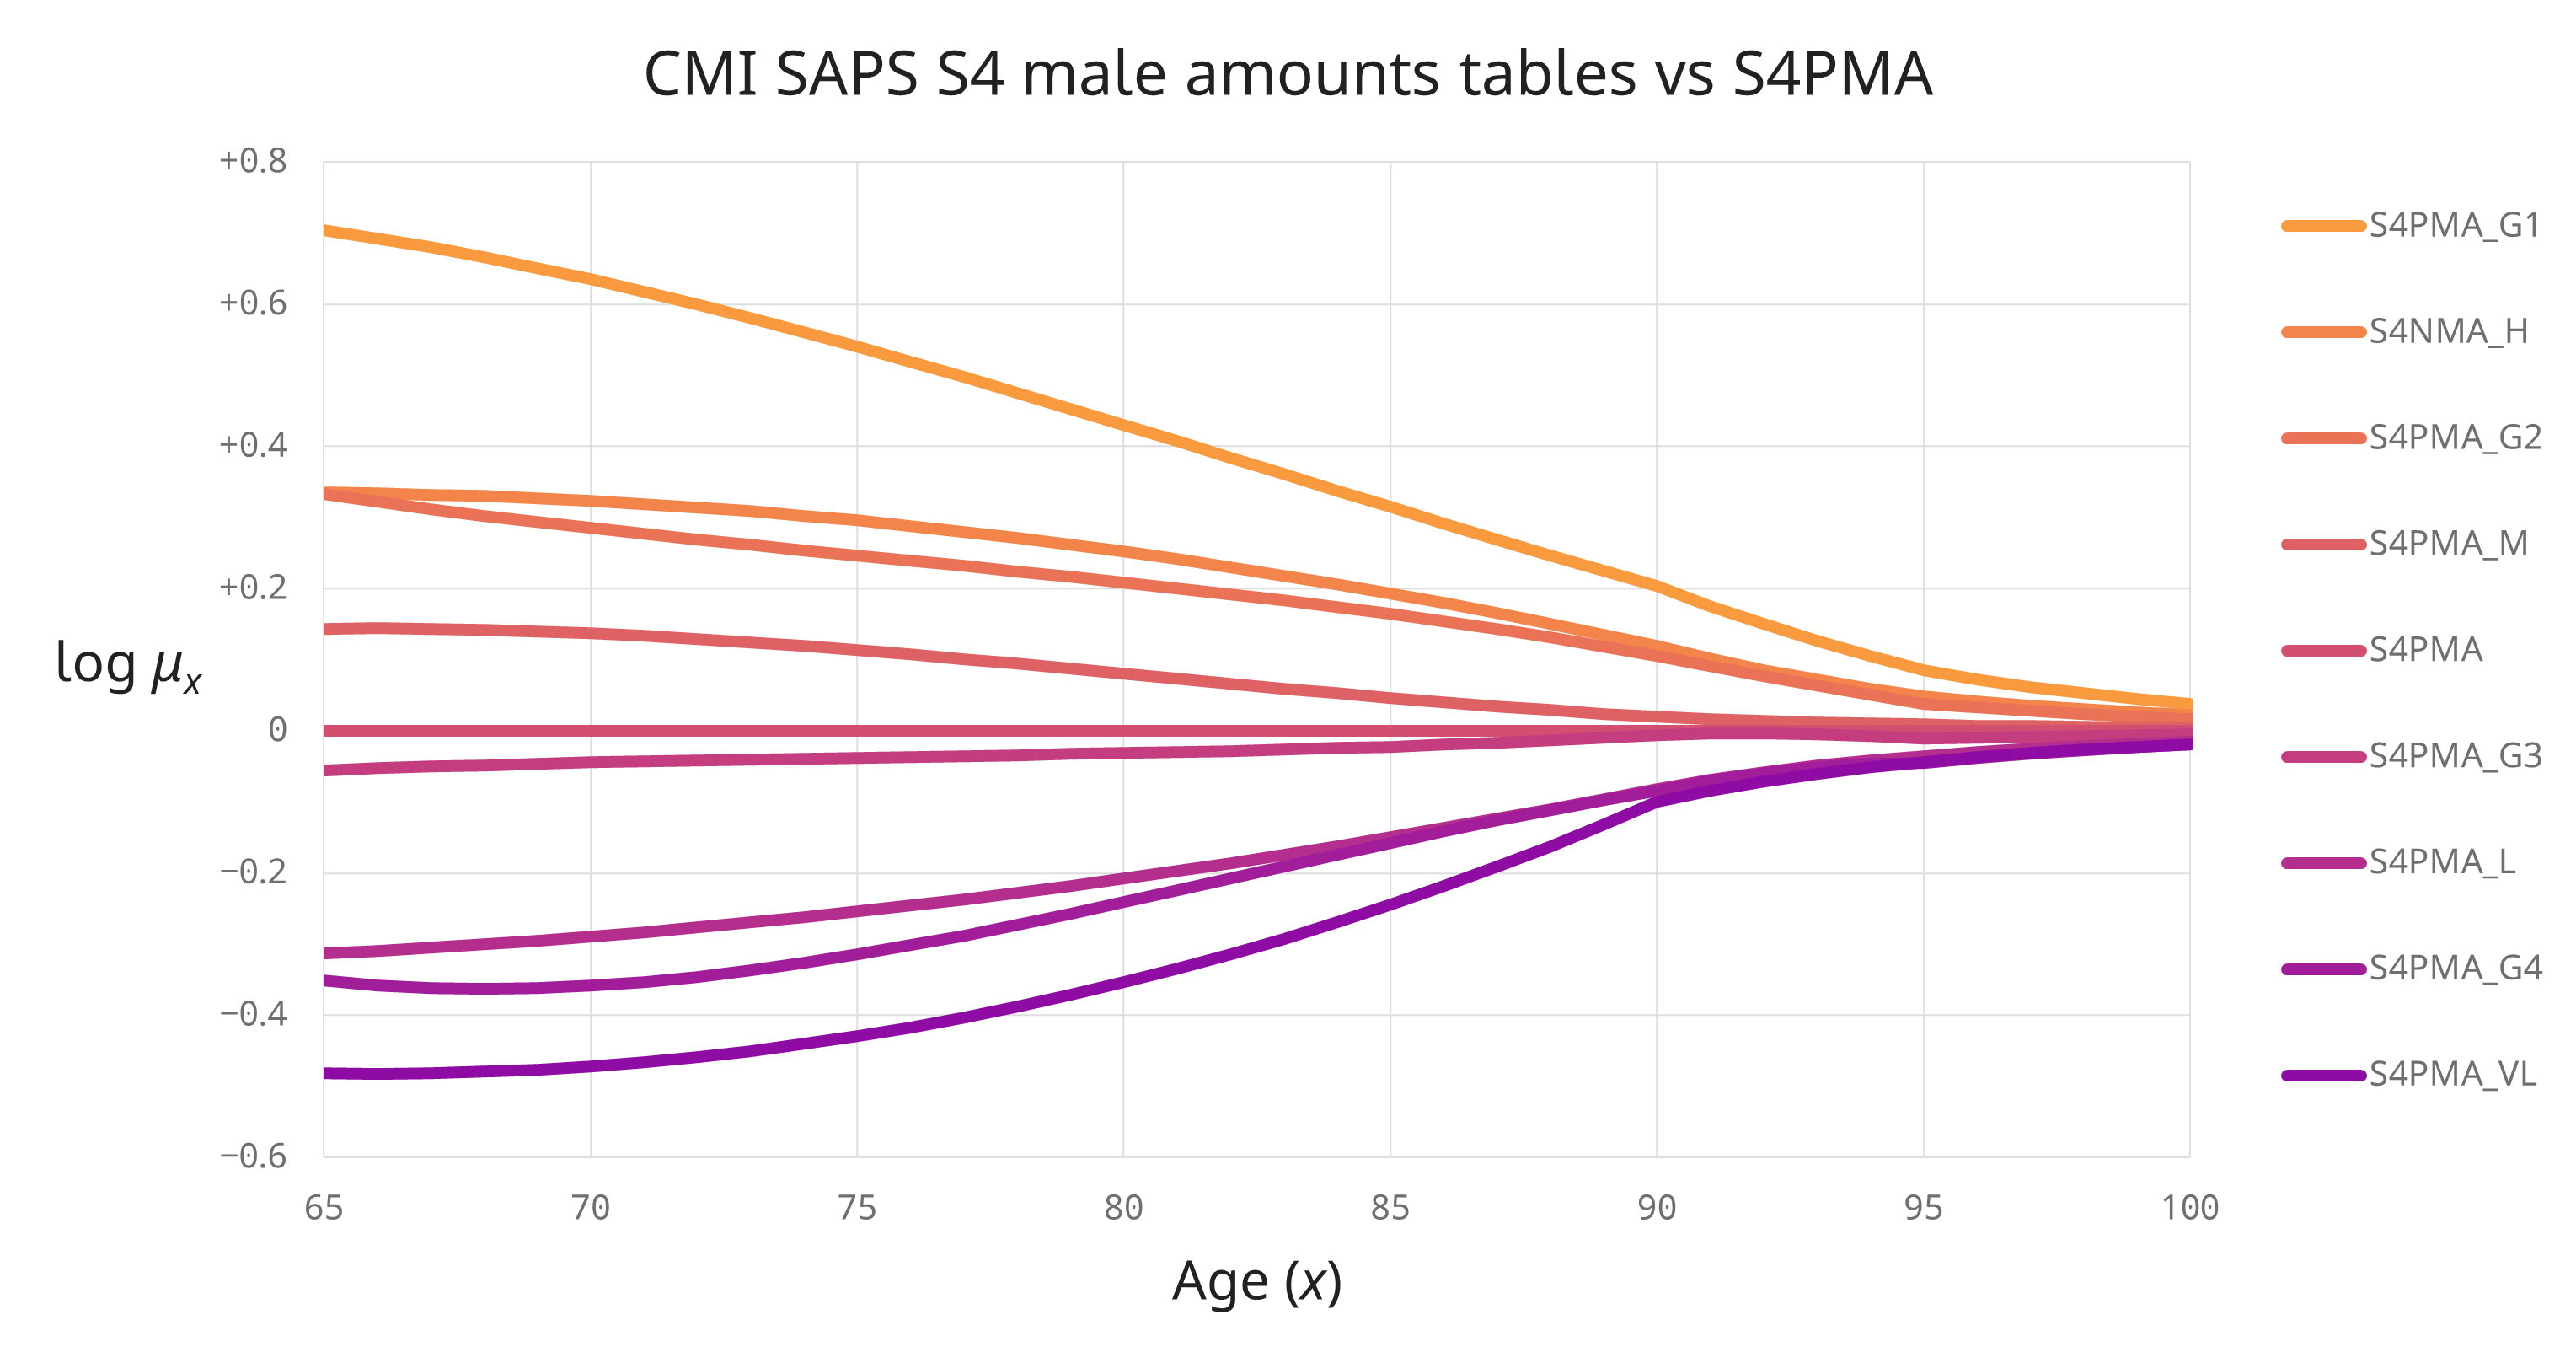
Don’t just take my word for it; here’s how log mortality varies for the CMI’s S4 male pensioner base tables:
Articles in this series
Just to be clear, while the convergence of mortality rates at the ‘younger’ ages (below, say, age 85) in the above graph is present in the SAPS data, the convergence at higher ages (where there are fewer data and data errors cause more distortion) is actually enforced by the CMI, i.e. not 100% driven by the SAPS data. This is still evidence, albeit of a different type, in that
- the CMI has invested considerable resources in understanding high age mortality – see the HAMWP reports WP100 and WP122, and
- there is a huge amount of diverse mortality expertise amongst the CMI volunteers and secretariat, with the SAPS committee’s approach itself having evolved in line with improved understanding1.
General model
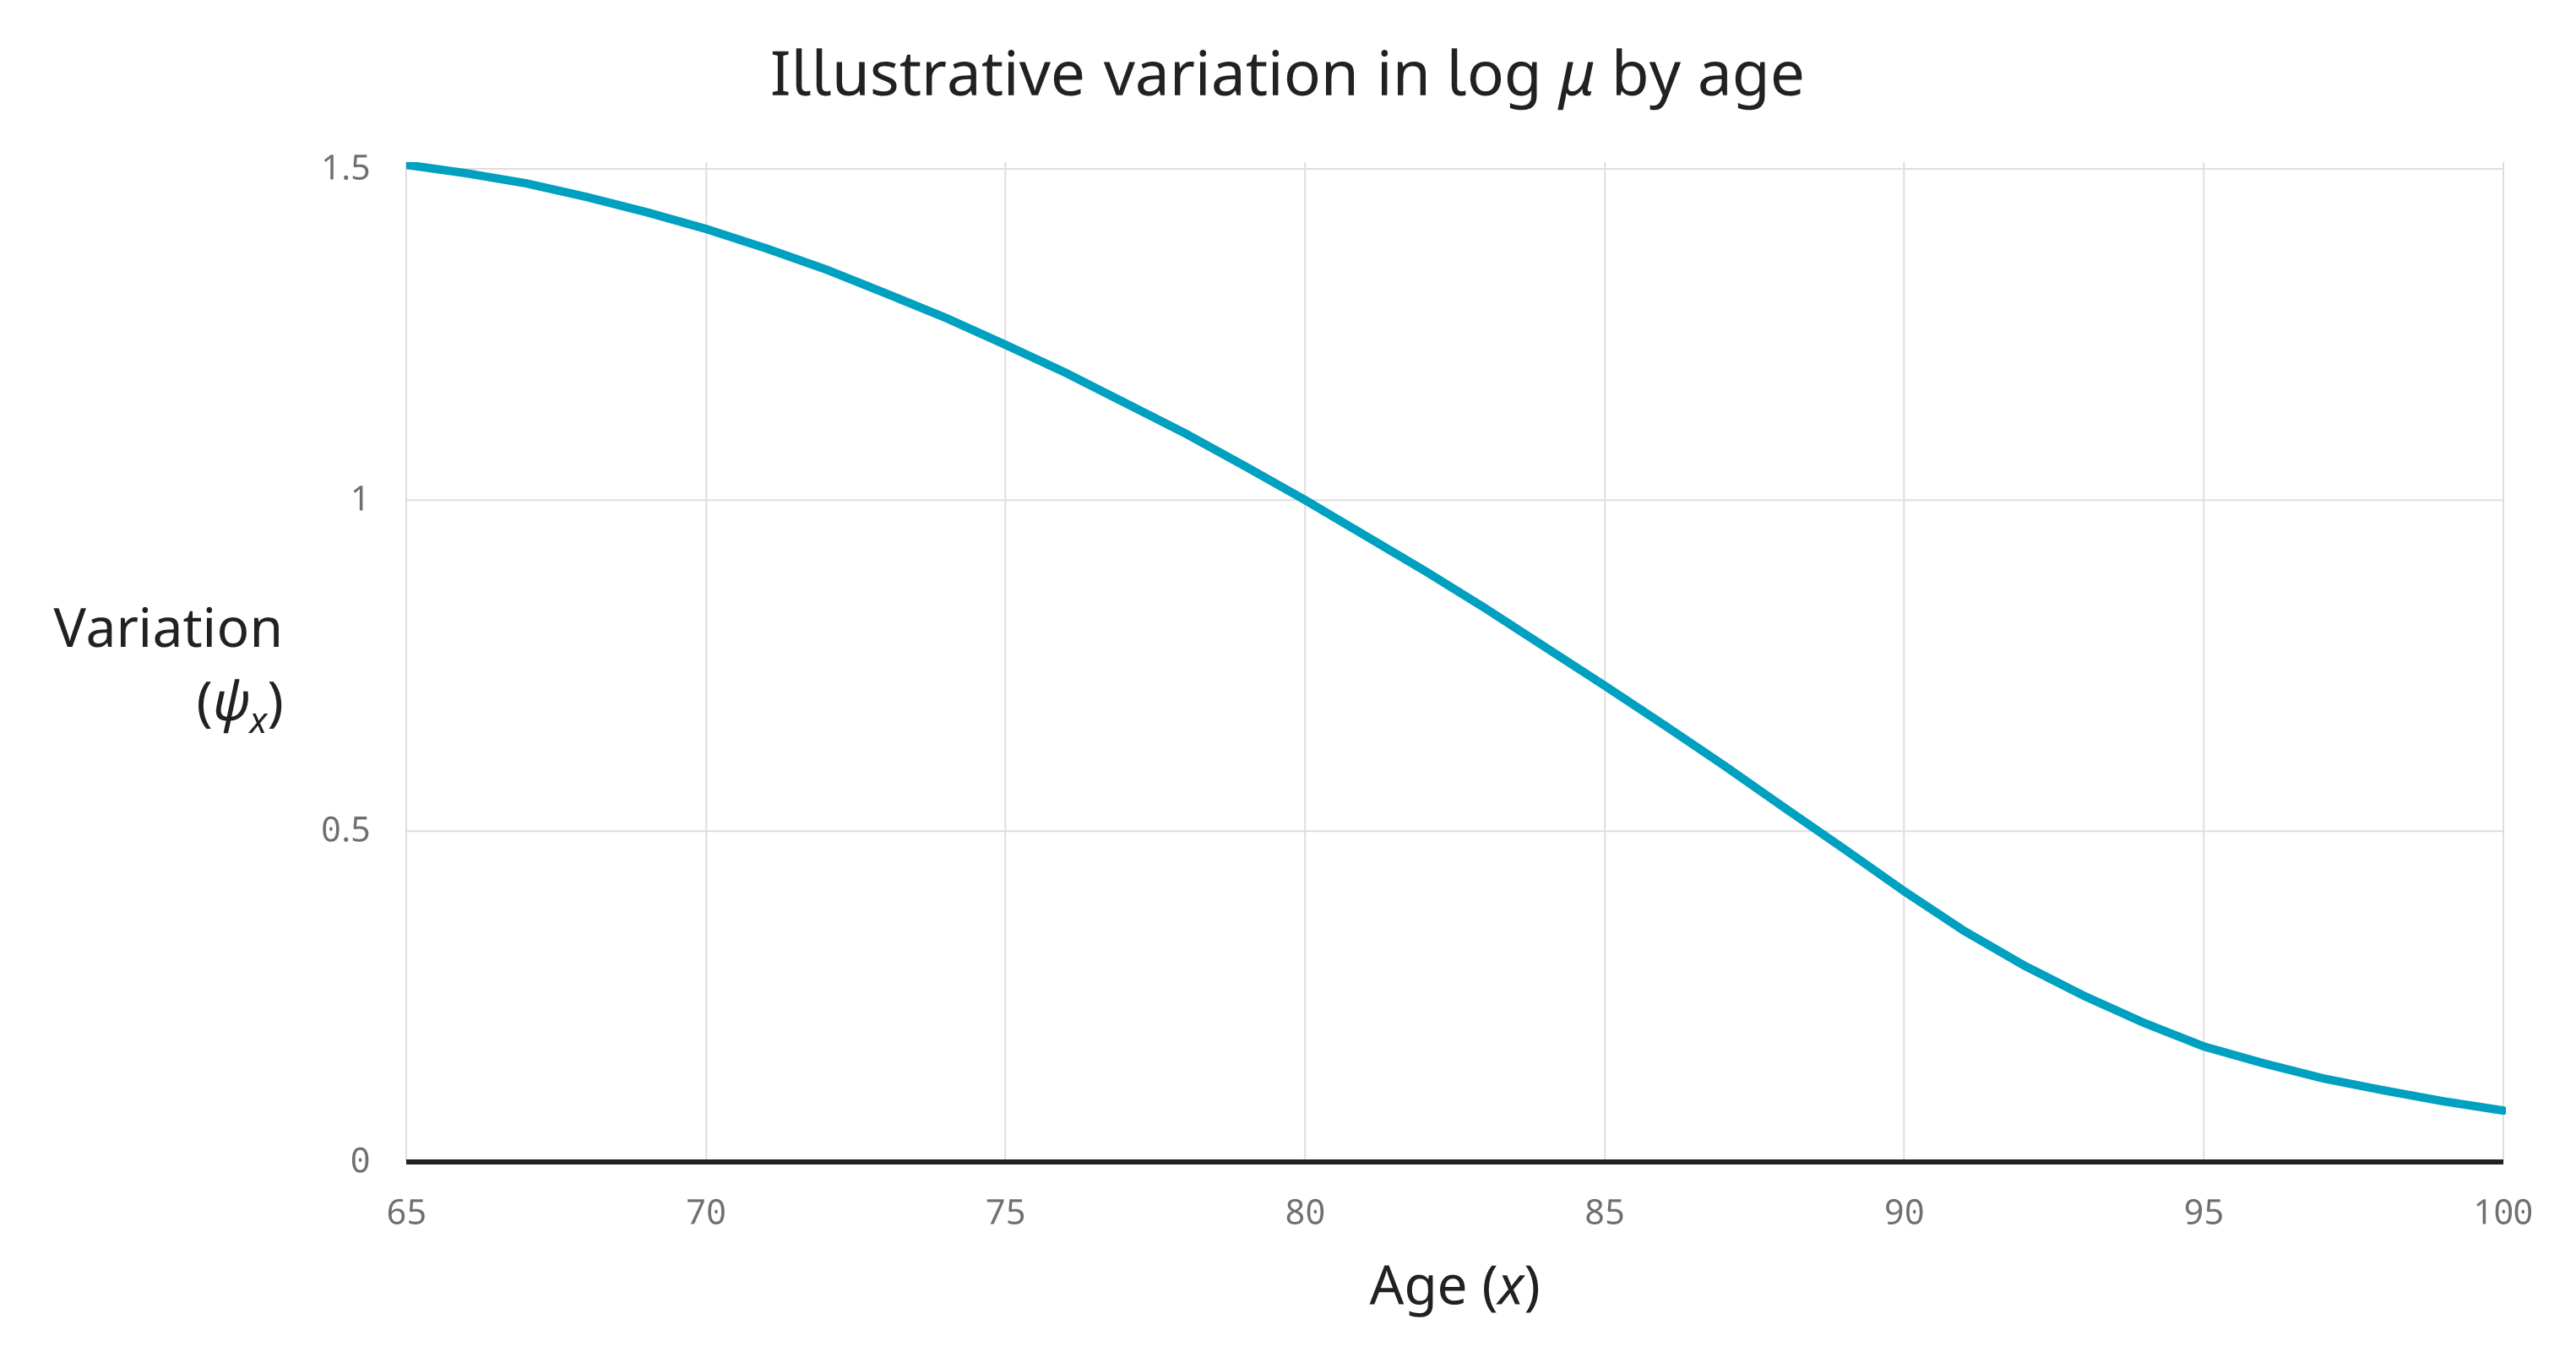
What this means is that we can represent most of the information present in the above S4 base tables on a one dimensional scale, i.e.
\[\mu_x(\beta)= \mu_x^\text{ref} \exp\big(\beta\,\psi_x\big)\]
where \(x\) is age, \(\mu_x^\text{ref}\) is a common base mortality and \(\psi_x\) is a common pattern of mortality variation by age that looks something like this:
Identifying variation by individual and by time
The age pattern of contemporary variation in mortality by individual is remarkably similar to the age pattern of mortality variation over the medium-to-longer timescales; so much so that it’s tempting to identify them, i.e. assume they’re the same thing.
(This is not true for pensioner mortality variation over short timescales – it typically increases with age.)
Variation (\(\psi_x\)) tending to zero at high ages is equivalent to mortality converging at high ages.
I’ve used CMI S4 because it’s the gold standard for UK DB pensioner base mortality, but this pattern of a common convergence pattern by age is generally applicable for DB pensioners.
Slightly more strongly, I assert that the complexity of modelling mortality variation for DB pensioners can reasonably be reduced to modelling the variation in a single parameter for each of male pensioners, female retirees and female dependants.
And because \(\psi_x\gt0\), this variation is monotonic.
Insight 14. The bulk of pension plan mortality variation can be captured on a monotonic one dimensional scale
Modelling base mortality for UK DB pension plans can reasonably be reduced to modelling a single parameter for each of male pensioners, female retirees and female dependants, i.e.
\[\mu_{it}(\beta)= \mu_{it}^\text{ref} \exp\big(\beta\psi_x\big)\]
where \(x\) is age as a function of birth date from individual data \(i\) and time \(t\), \(\mu_{it}^\text{ref}\) is a common base mortality and \(\psi_x\) is a common (non-negative) pattern of mortality variation by age that tends to zero at high ages.
Related points
There is a lot more to say in relation to the shape of mortality and the shape of mortality variation, and I hope to come back to this in a future article. For now, I’ll restrict myself to a few passing comments:
-
I expect that some models in current use do not make the same simplifying assumption as above and that their authors believe that the added complexity makes their models superior. While not dismissing this out of hand, I would make a couple of points:
-
I suggest that there is more information content in allocating individuals to lower or higher mortality than there is in the precise shape of mortality by age.
-
I’ve had opportunities over the years to compare the postcode-based mortality model Miles Blackford and I developed at Aon with a couple of others produced by competitors I respected, and my empirical observation (based on an admittedly small sample) is that they came up with broadly similar results3.
-
-
Using a common pattern of variation between sub-groups is potentially more robust than calibrating sub-groups separately. For instance, I doubt that some of the shape complexity in the S4 variation graph at the top of this article is genuinely predictive5.
-
Incorporating ill health mortality would require an additional variation component, i.e. variation would no longer be one-dimensional6. But allowing for ill-health mortality in pension plans (a) does not usually move the needle much in terms of overall PV impact and (b) comes with complications that can cause models to be less robust in practice7.
-
It is reasonably well known that the apparent plateauing of observed population mortality at high ages does not necessarily mean that underlying individual mortality plateaus at high ages8. A similar caveat applies to apparent mortality convergence. But this is notoriously hard to determine one way or another and, in my experience, is often relegated to the too-hard category (if it’s even thought about at all).
Next article: Good things come to those who weight (I)
So far, the articles in this series have been mostly uncontentious. While treating \(\text{A}\) and \(\text{E}\) measures as foundational is, I think, intuitive, expressive and concise (and something that I have not seen elsewhere), it is ultimately just a nice way of expressing reasonably standard maths.
I have taken care to ensure that the option of using a weight has been preserved in the formalism because this matters but it is often overlooked. Indeed, it is a feature of this formalism that a weight is required9 (even if it’s simply \(1\)).
The next article will be the first of three on using weighted statistics to assess pension liabilities. Now this is contentious in some circles, to the point of being attacked as invalid. An alternative view is that it marks a dividing line between actuarial work and abstract statistics. You be the judge.
-
For instance, variation by age in log-mortality for the S1 series initially converges by age but then actually starts to diverge before being forced to reconverge again at the very highest ages. And for the S2 series (which predated the HAMWP), convergence was enforced at age 95, which I now think is too early2. ↩
-
I was on SAPS committee when it produced S2, and so I’m partly responsible for that too-early age convergence. On the plus side, repeated concerns about getting high age mortality SAPS mortality right was one of the motivations behind setting up the HAMWP. ↩
-
This does not mean that all postcode-based or other base mortality models are good; far from it. In my time I’ve encountered
- a model that produced results that defied actuarial common sense, which I suspect was down to users misunderstanding the inputs required and / or maybe software error,
- models constructed from promising-sounding components but where the resulting models were not themselves tested statistically rigorously4 against actual data, and
- a mortality modelling process that, by its very design, would produce biased results.
-
By ‘rigorously’, I mean testing the resulting model using leave-one out cross validation on mortality experience data by pension plan, or some variation thereof. ↩
-
This is not a slight on the CMI – the tables produced by CMI’s SAPS committee are exemplars for actuarial professions in other locales. ↩
-
The same is true of any select mortality. ↩
-
Problems with incorporating ill health mortality in pension plan modelling include:
- Ill-health pensioner experience data is typically not very credible (because ill-health pensioners are a small fraction of the overall pensioner population and because the excess mortality from ill-health declines with time).
- Many UK pension plans have tightened their criteria for ill health retirement over time, which ill health status is an incoherent rating factor and using it will bias forecasts.
- Pension plan ill health criteria are not comparable between pension plans.
- Ill health retirement cannot be used as a rating factor for individuals yet to retire without further assumptions, which are themselves hard to calibrate.
-
This is an example of a potential ecological fallacy. ↩
-
As the function argument to the \(\text{A}\) and \(\text{E}\) measures. ↩